


QUICK SUMMARY
Most telecom carriers are drowning in data but starving for insights. You have green lights on your dashboard, yet customers are opening tickets about “choppy audio.” Traditional VoIP monitoring is reactive.
This blog details how to move from simple “up/down” checks to true VoIP observability. We cover how to handle high cardinality in Prometheus, how to speed up Grafana VoIP dashboards using recording rules, and how AI-assisted analysis can detect silent failures like one-way audio before they impact your SLA.
In the telecom world, “monitoring” and “observability” are often used interchangeably, but they are fundamentally different.
Monitoring tells you the server is up.
VoIP Observability tells you why the call quality is bad.
For years, carriers have relied on simple SNMP traps and SIP OPTIONS pings. If the server responded to a ping, the dashboard turned green.
But a green dashboard doesn’t mean your customers can hear each other. You can have 100% server uptime and still suffer from 10% call failure due to a routing loop or a silent RTP dropout.
To survive at a carrier scale, you must move beyond static thresholds. You need a system that correlates the SIP signaling (Call Setup) with the RTP stream (Media Quality) and uses AI to understand what “Normal” looks like.
This blog explores how to re-architect your VoIP monitoring stack using Prometheus, Grafana, and AI-assisted analysis to catch issues before your customers do.
Why Standard Prometheus Setups Fail at Carrier Scale
The most common mistake we see in VoIP observability is the “Cardinality Explosion.”
Prometheus is a time-series database. It is incredibly fast at aggregating numbers (e.g., “Total Calls”). But, it is incredibly bad at storing unique text strings (e.g., “Call-ID: 12345-abcde”).
If you configure your exporters to label every single metric with the call_id or remote_ip, you create a unique time series for every single phone call.
Result? Your RAM usage spikes, your Prometheus server crashes (OOM Kill), and your Grafana VoIP dashboards time out.
The Fix: Aggregation at Ingest
You must aggregate metrics at the “Trunk” or “PoP” (Point of Presence) level, not the “Call” level.
- Bad Label: sip_responses_total{call_id=”xyz”, status=”503″}
- Good Label: sip_responses_total{trunk=”twilio_east”, status=”503″}
For detailed debugging (finding the specific call that failed), do not use Prometheus. Use a specialized logging stack like Loki or Elasticsearch (ELK). Prometheus tells you that you have a problem; Loki tells you where it is.
Ecosmob Expert Tip
In your prometheus.yml configuration, use metric_relabel_configs to aggressively drop high-cardinality labels at the source. If an exporter sends a client_ip label, drop it immediately unless it is a fixed gateway IP. This simple hygiene step can reduce your storage requirements significantly and speed up query times by orders of magnitude.
How to Speed Up Grafana Loading with Recording Rules?
If you open your global network health dashboard and it takes 40 seconds to load, your observability is failing. The delay happens because Grafana is asking Prometheus to calculate the “Average Call Duration” for 10 million data points in real-time.
To fix this, you must shift the math from “Query Time” (when you look at the dashboard) to “Ingest Time” (when the data arrives). You do this with Prometheus Recording Rules.
What is a Recording Rule?
It is a pre-calculated metric. Instead of asking Prometheus to calculate the rate(sip_invites[5m]) every time you refresh the page, you tell Prometheus to calculate it every 15 seconds and save the result as a new metric called job:sip_invites:rate5m.
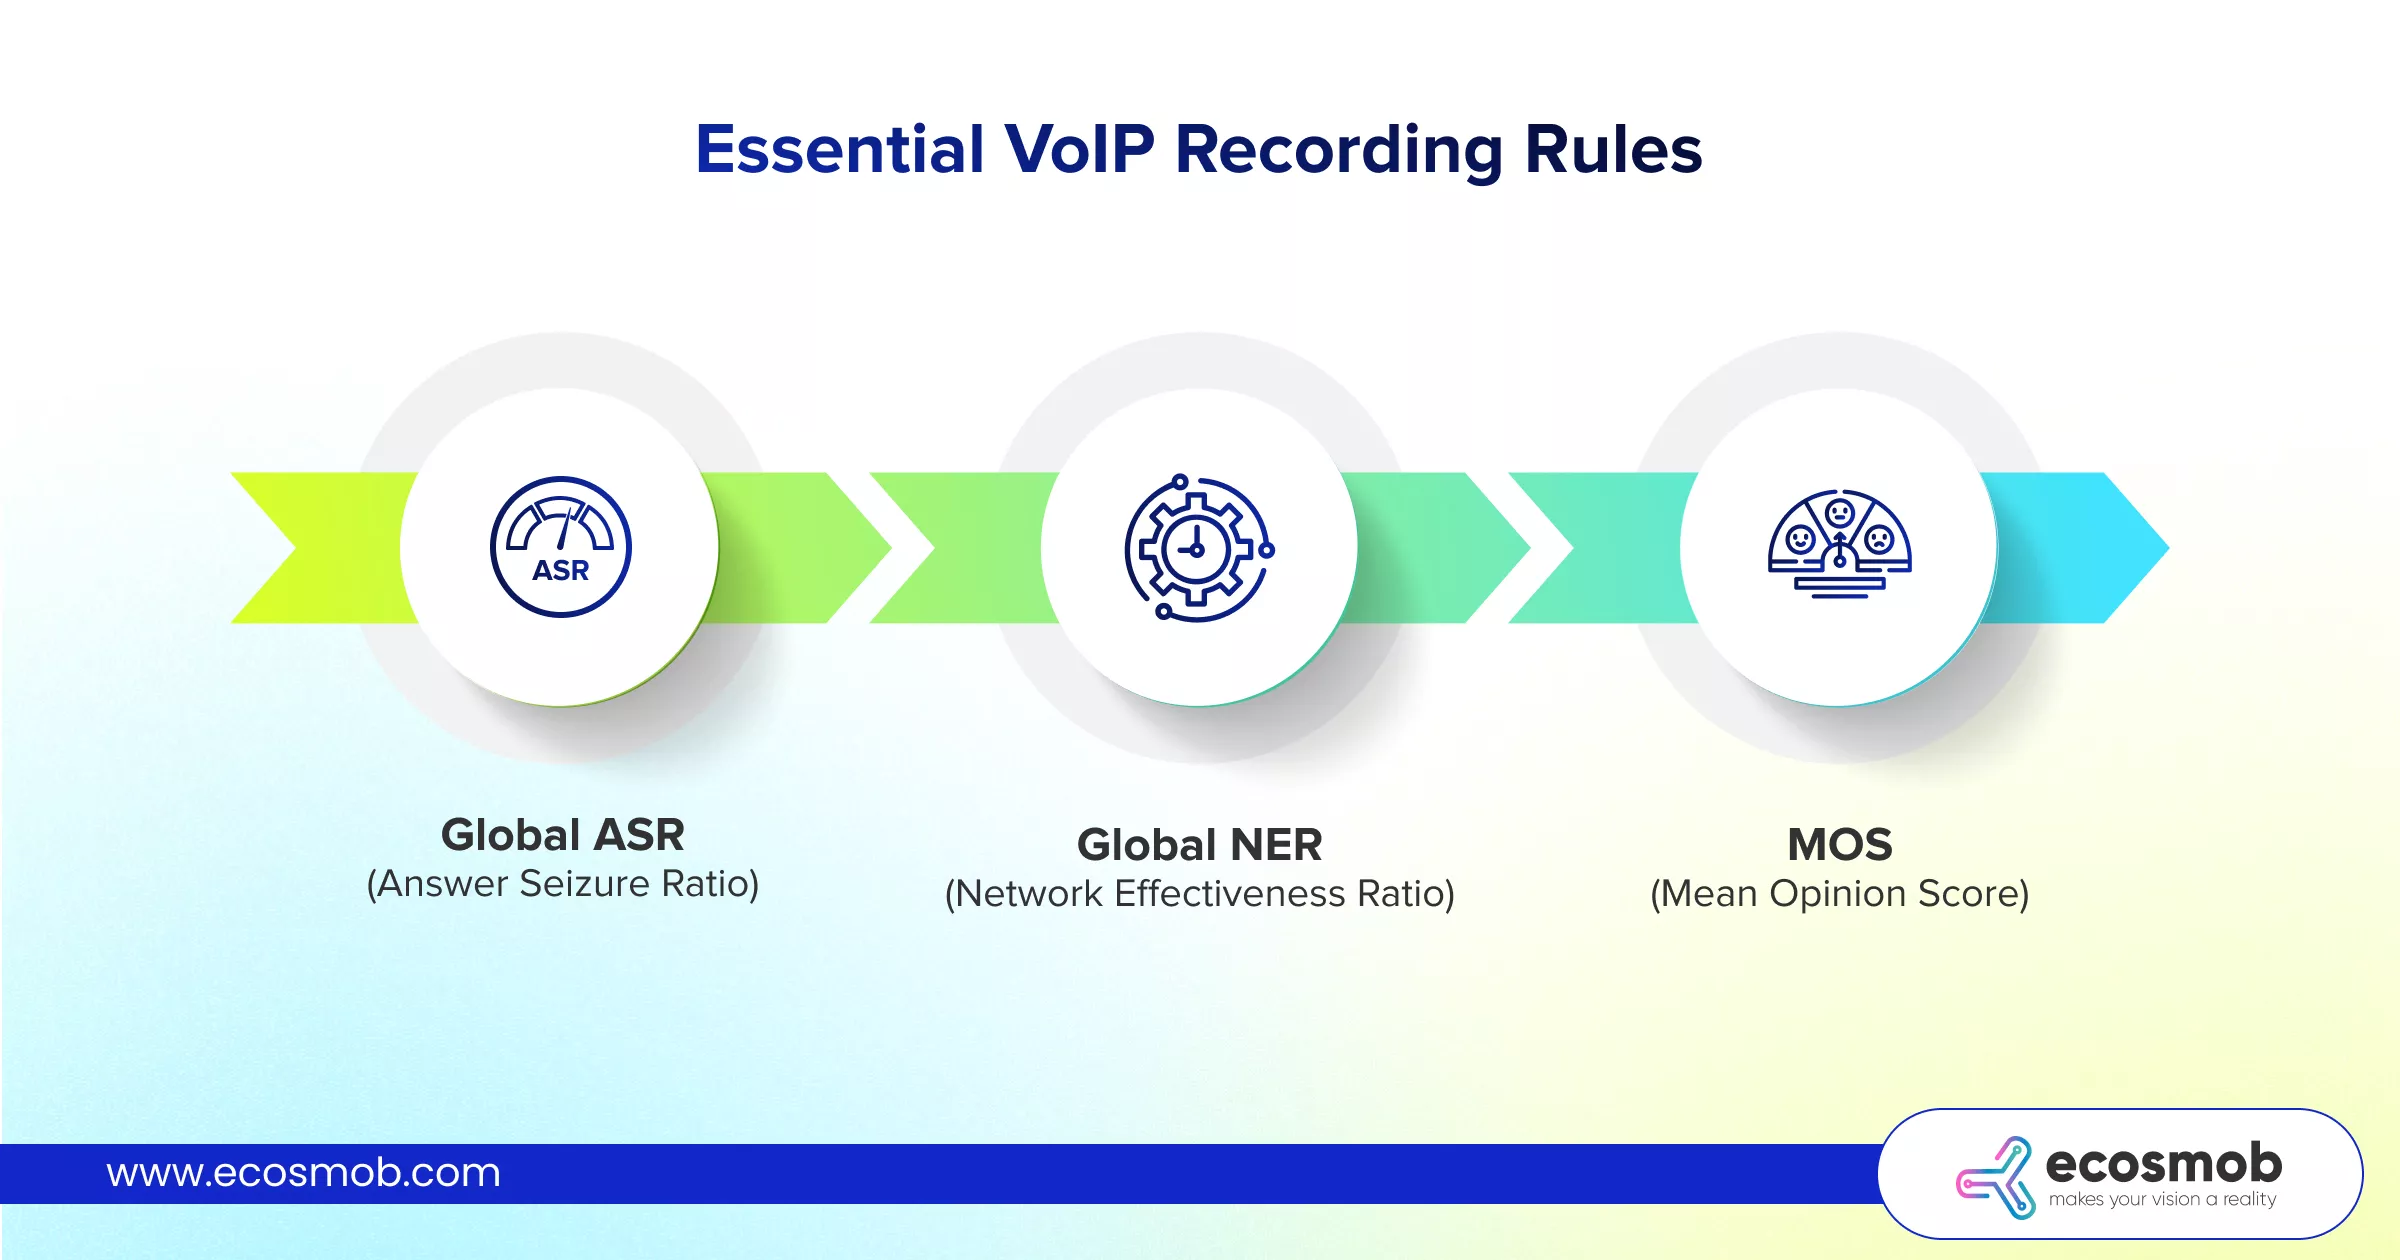 Essential VoIP recording rules:
- Global ASR (Answer Seizure Ratio): Pre-calculate the ratio of successful calls to total attempts per trunk.
- Global NER (Network Effectiveness Ratio): Pre-calculate the ratio of calls that reached the destination (even if busy/no-answer) vs. network failures.
- MOS (Mean Opinion Score): Pre-aggregate the average RTP quality score per region.
By implementing these rules, your Grafana VoIP panels will render instantly, allowing your NOC (Network Operations Center) team to spot spikes the moment they happen.
Green lights on the dashboard, but users still complaining?
Implementing AI for Dynamic Thresholds for VoIP Alerts
The enemy of effective monitoring is “Alert Fatigue.” If you set a static alert: “Page me if ASR drops below 50%.”
- At 2:00 PM: 50% ASR is a disaster. You should be alerted.
- At 3:00 AM: You only have 2 calls on the network. One fails. ASR is 50%. You get woken up for nothing.
The Fix: AI VoIP Monitoring (Dynamic Baselines)
Instead of a hard number, you need an alert that says: “Page me if the ASR is significantly lower than it usually is at this specific time of day.”
You can achieve this using standard Prometheus functions (like Holt-Winters) or by integrating AI-assisted adaptors.
- The Logic: The system analyzes the last 4 weeks of data to build a “Confidence Band.” It knows that on Tuesdays at 3:00 AM, an ASR of 40% is normal. But on Tuesdays at 10:00 AM, anything below 90% is an anomaly.
- The Alert: You only get paged when the metric breaches this dynamic confidence band. This reduces false positives by a massive margin, ensuring that when your phone buzzes, it’s a real emergency.
Is Your Stack Ready for Carrier-Grade Scale?
Dynamic thresholds are just one piece of the puzzle. To achieve 24×7 availability and regulatory compliance, you need a robust, layered monitoring architecture. Read our comprehensive guide on transforming reactive alerts into predictive intelligence!
How to Detect One-Way Audio Before the Customer Complains?
One-way audio is the silent killer of VoIP companies. The SIP signaling looks perfect (200 OK), the call is “Connected,” but one side hears silence.
Because the call didn’t “fail” in the signaling layer, standard dashboards show it as a success.
SIP & RTCP Correlation
To detect this, you must correlate the Control Plane (SIP) with the Media Plane (RTP/RTCP).
- SIP State: The call is in STATE_CONFIRMED.
- RTP State: You are receiving RTP packets from Source A, but zero packets from Source B.
AI-Assisted Detection
An AI model can monitor the rtcp_xr (Extended Report) metrics in real-time. It looks for a specific pattern:
- call_state = active
- rtp_packets_received < 10 (after 5 seconds)
- jitter = 0
If this pattern persists for more than 5 seconds, the AI flags the route as “Suspect.” If multiple calls on the same trunk show this pattern, the AI can automatically disable that trunk and reroute traffic, solving the problem before a human even opens the ticket. This is the pinnacle of proactive VoIP observability.
Catch SIP trunk failures before the hard outage.
Visualizing the Global Health of Your Voice Network
NOC screens are often cluttered with many graphs (CPU, RAM, Bandwidth, ASR, ACD, PDD). It is impossible to glance at the screen and know “Are we healthy?”
The Single Pane of Glass
You should build a “Composite Health Score.” This is a single number (0-100%) that aggregates your key KPIs.
Composite Health Score Formula
Health = (ASR_Weight * ASR_Score) + (MOS_Weight * MOS_Score) + (Success_Weight * NER_Score)
- ASR (Answer Seizure Ratio): Weighted 40%.
- MOS (Mean Opinion Score): Weighted 40%.
- NER (Network Effectiveness Ratio): Weighted 20%.
Create a Grafana “Stat Panel” that displays this calculated metric.
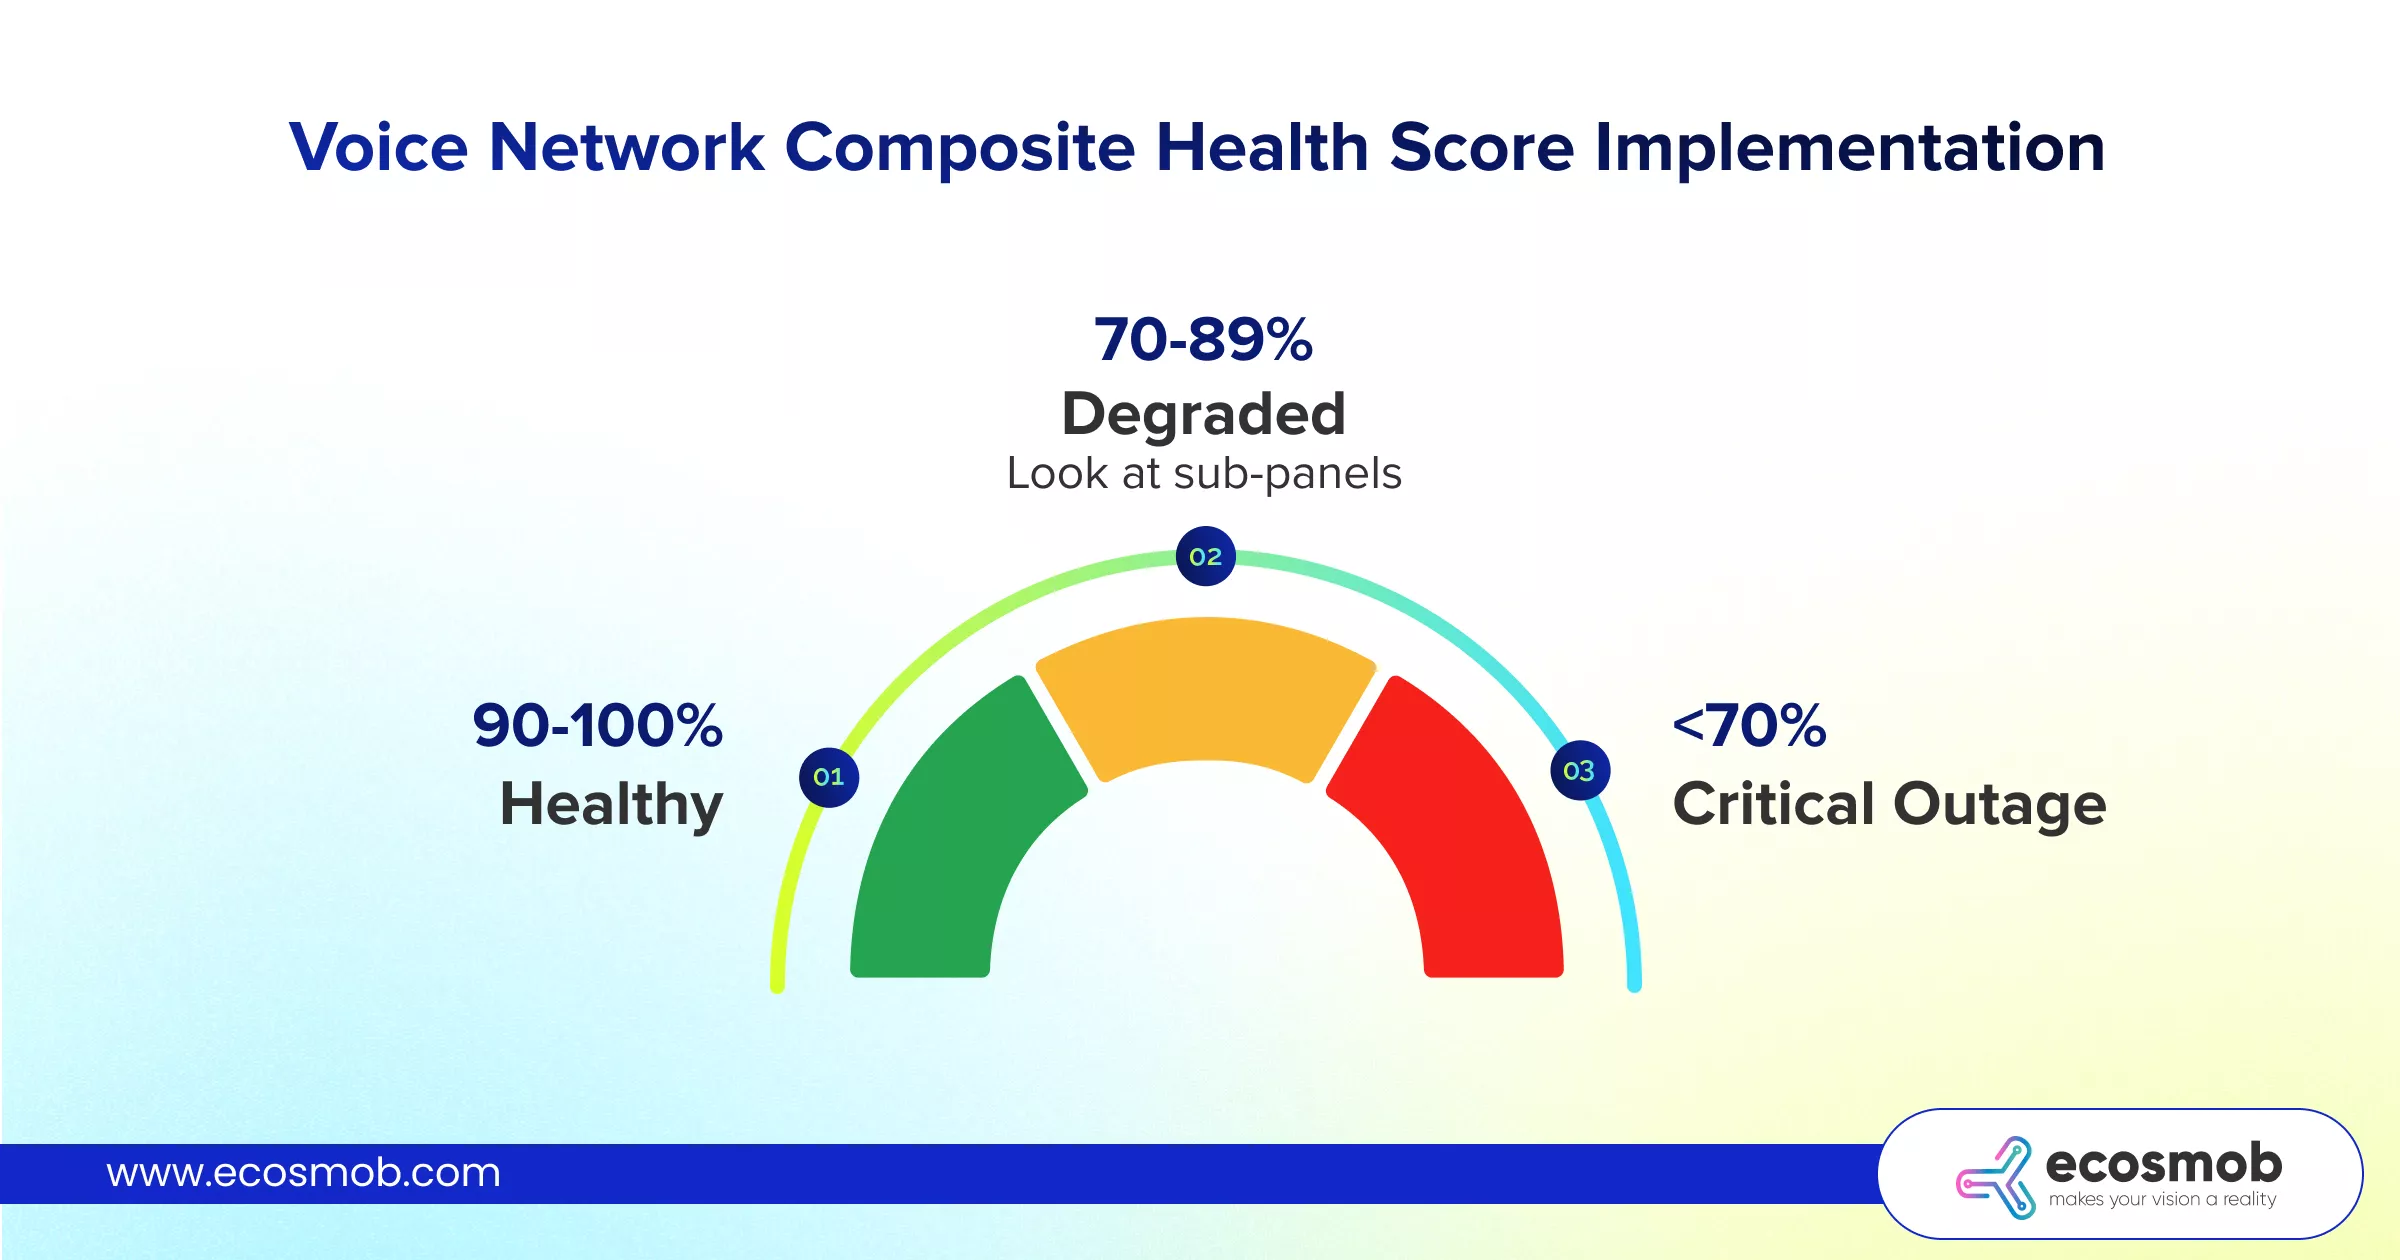
- Green (90-100%): Healthy.
- Yellow (70-89%): Degraded (Look at sub-panels).
- Red (<70%): Critical Outage.
This allows executives and support staff to understand the network status instantly without needing to interpret complex VoIP monitoring graphs.
The transition from legacy monitoring to modern VoIP observability is about context. It’s about moving away from “The server is up” to “The service is healthy.”
By optimizing Prometheus to handle cardinality, using recording rules to speed up insights, and applying AI VoIP monitoring to detect anomalies, you transform your operations center.
You stop reacting to customer tickets and start fixing problems before the customer even hangs up.
Ready to build a predictive observability stack? Connect with our experts today!
FAQs
Can AI predict a SIP trunk failure before it happens?
Yes. AI models analyze "leading indicators" that humans often miss. For example, a slight increase in 503 Service Unavailable responses or a gradual rise in PDD (Post-Dial Delay) often precedes a total trunk failure. AI VoIP Monitoring can detect this trend deviation hours before the hard failure occurs, allowing you to reroute traffic proactively.
What is the difference between ASR and NER in VoIP observability?
ASR (Answer Seizure Ratio) measures successful calls divided by attempts. However, ASR drops if the user is simply busy or doesn't answer (which isn't a network fault). NER (Network Effectiveness Ratio) filters out "User Busy" and "No Answer" errors, focusing only on network-side failures. NER is a much better metric for judging the technical health of your VoIP monitoring system.
How do I set up Prometheus recording rules for VoIP?
You define them in your prometheus.yml file under the rule_files section. You write a PromQL query that aggregates the metric (e.g., sum(rate(sip_invites[1m]))) and assign it a new name (e.g., job:sip_invites:rate1m). Prometheus then computes this in the background, making dashboard queries instant.
How can I detect one-way audio using Grafana?
You need an exporter (like RTPEngine or Homer) that sends RTCP stats to Prometheus. You then create a Grafana alert that triggers when rtp_packets_sent > 100 AND rtp_packets_received == 0 for any active call stream.
What are the best metrics to monitor for VoIP quality?
Beyond simple up/down status, you must monitor MOS (Mean Opinion Score), Jitter, Packet Loss, PDD (Post Dial Delay), and Registration Latency. These metrics give you the true "Customer Experience" view rather than just the "Server Health" view.
Who offers robust monitoring and observability setups for large-scale VoIP systems?
At carrier scale, you need more than tools, you need architecture. Ecosmob design and deploy custom observability stacks using Prometheus, Grafana, and AI-driven analytics tailored for high-volume VoIP environments.
What is the difference between VoIP monitoring and observability?
Monitoring tells you if a system is up. Observability tells you why call quality is poor, even when everything appears operational.
Why do traditional VoIP monitoring setups fail at large scale?
Legacy setups rely on static checks like SIP pings or SNMP traps, which miss deeper issues like RTP drops or routing failures.
Why does Prometheus struggle with VoIP monitoring at carrier scale?
Improper configuration leads to “cardinality explosion,” where tracking every call creates massive data loads, causing system crashes and slow dashboards.
How can VoIP observability systems be optimized for performance?
Key strategies include aggregating metrics at trunk or region level, dropping high-cardinality labels, using recording rules for pre-calculated metrics and separating metrics (Prometheus) and logs (Loki/ELK).