


QUICK SUMMARY
Here’s what this blog walks you through:
- how SBC congestion quietly forms,
- why traditional monitoring misses the early signs,
- and how AI-assisted analytics helps teams act before outages show up.
Here’s a question worth sitting with for a second: When an SBC outage happens, was it really unexpected, or was it just unnoticed?
Because outages don’t appear out of thin air. They don’t wake up one morning and decide to ruin your SLA. What actually happens is quieter, slower, and far more dangerous.
⚠️ Traffic starts behaving slightly differently.
⚠️ Calls take a fraction longer to set up.
⚠️ Retries increase, but not enough to panic anyone.
⚠️ Packet loss stays “acceptable,” yet feels off if you’re listening closely.
Nothing triggered an alert condition in an SBC. So nothing gets attention. Until customers notice.
That’s the gap most teams operate in: somewhere between “everything looks fine” and “why is this happening?” Traditional monitoring struggles there. And when problems go unnoticed, the impact isn’t limited to call quality; it leads to regulatory compliance violations (HIPAA, GDPR…), SLA penalties, and lasting damage to trust.
This blog looks at why early warning signs of SBC congestion exist, why they’re often missed, and how AI-assisted analytics helps teams spot issues before they turn into outages.
So, what does SBC traffic look like?
The Early Warning Signs of SBC Congestion
SBC traffic naturally varies across multiple dimensions.
Voice traffic is not static. It changes constantly based on usage patterns, geography, and media behavior. These variations shape how an SBC behaves under load and why defining a single baseline rarely works in practice.
Time-of-Day Traffic Patterns – Traffic changes across the day. Business hours, off-hours, weekdays, and weekends all behave differently, and even minor events can shift patterns without changing call volume.
Geographic Traffic Distribution – Traffic varies by region. Different call origins follow different network paths and latency profiles, so localized congestion can exist even when overall traffic looks normal.
Codec, Packet Size, and Call Duration Variability – Media behavior varies by codecs, packet size, and call duration, causing similar call volumes to place very different loads on the SBC.
Relying on static baselines is risky because context changes.
“What looks abnormal in one scenario may be normal in another, and what looks fine at a high level can hide stress underneath.” and missing that is how early warning signals get dismissed as noise.
Reality Check
You don’t usually detect SBC congestion.
Your customers do.
Once you see how SBC congestion quietly forms, it’s clear why most monitoring catches it too late.
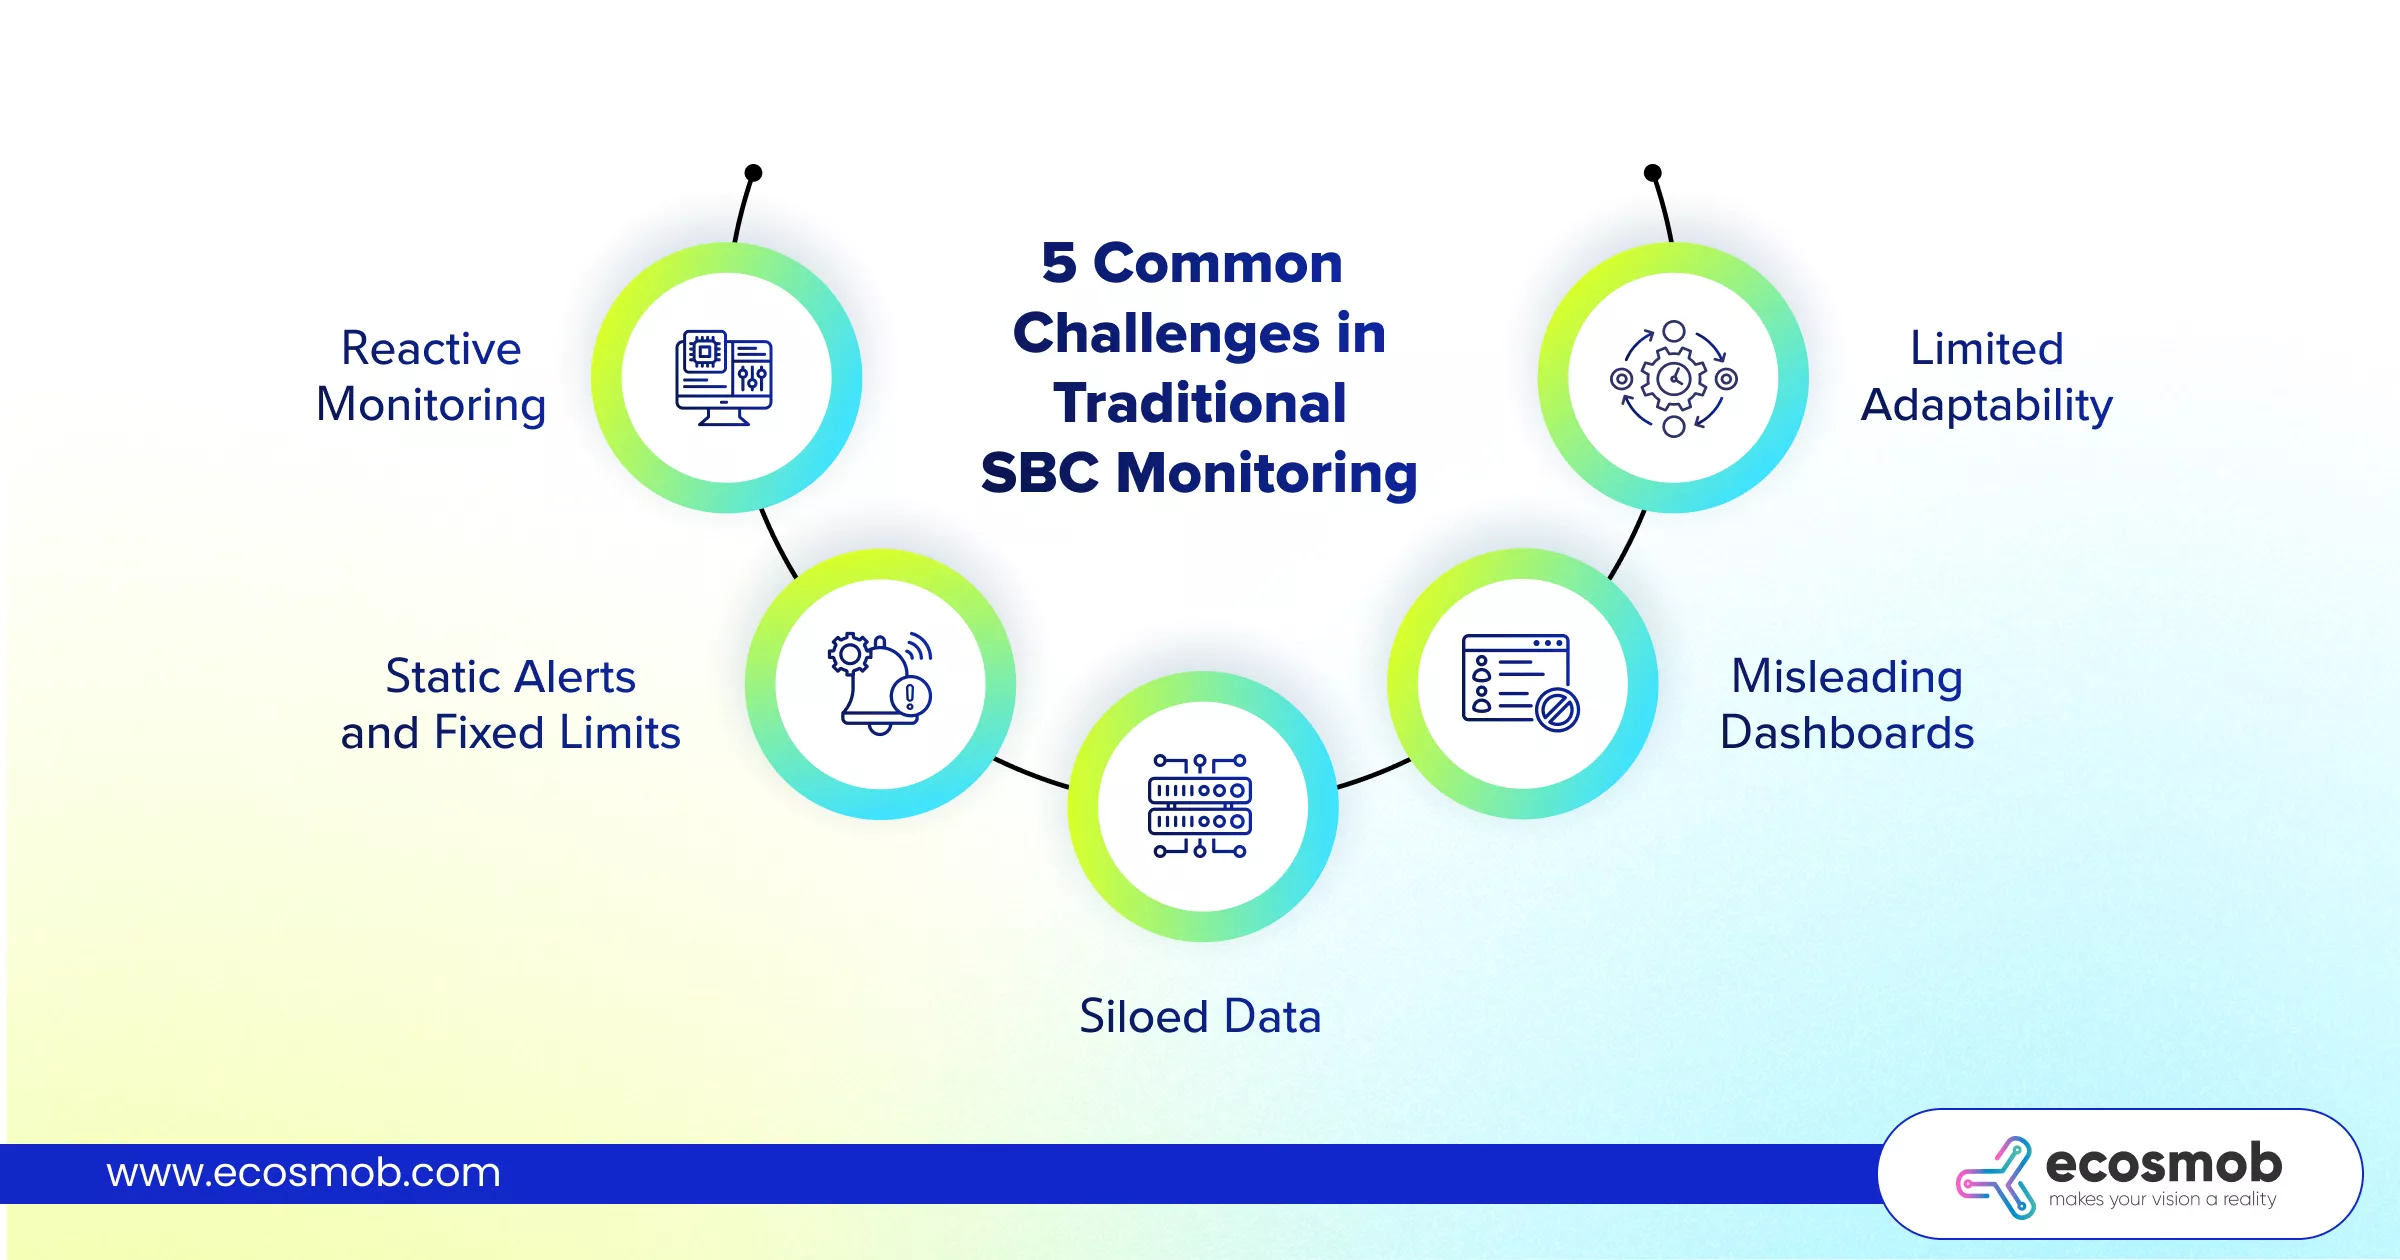
5 Common Challenges in Traditional SBC Monitoring
 Traditional SBC monitoring was built to answer one question well: “Is something broken right now?”
The problem is that congestion and failures don’t start that way. They build gradually, and that’s where most monitoring approaches struggle.
Here is how:
1. Reactive Monitoring
Most SBC monitoring focuses on familiar KPIs like CPS, concurrent calls, latency and jitter, and MOS. These metrics are useful, but they are inherently reactive. They trigger alerts only after service quality has already started to degrade.
By the time a metric crosses a preset limit, users are often already experiencing poor call quality. Early behavioral changes, the kind that signal trouble ahead, rarely surface through these metrics alone.
2. Static Alerts and Fixed Limits
Static alerting rules assume traffic behaves consistently, which isn’t true in real environments. Traffic patterns shift by time, geography, and use case, but thresholds don’t adapt.
As a result, teams either receive too many alerts that don’t matter or tune thresholds so conservatively that early warnings never trigger. Over time, this creates alert fatigue, and subtle but important signals get ignored.
3. Siloed Data
Logs, CDRs, SIP traces, and media statistics all provide valuable insights, but they are stored in separate systems and tell only part of the story. Logs explain what happened after the fact. CDRs summarize completed calls. SIP traces show signaling behavior in isolation.
What’s missing is correlation. Without connecting these layers, it’s difficult to see how small changes across signaling, media, and infrastructure combine into real risk.
4. Misleading Dashboards
One of the biggest challenges is the gap between system health indicators and actual call experience. Dashboards can look stable while call setup slows, retries increase, or audio quality quietly declines.
Traditional monitoring reports the status. It doesn’t interpret behavior. And that’s why issues often surface first through customer complaints rather than alerts.
5. Limited Adaptability
Modern SBC environments evolve constantly, new routes, new codecs, new traffic mixes, new partners. Traditional monitoring tools don’t learn from these changes; they expect operators to manually adjust rules and baselines.
That lag creates blind spots, especially during growth, migrations, or sudden traffic shifts.
| A Quick Snapshot📸 | |
|---|---|
| Traditional Monitoring | AI-assisted Analytics |
| Reacts to failures | Detects behavioral drift |
| Watches metrics | Understands patterns |
| Works on limits | Learns normal traffic |
| Explains outages | Helps prevent them |
When monitoring only tells you what broke after the fact, the next step isn’t better dashboards; it’s a different way of reading the signals altogether.
Click to always stay one step ahead of SBC congestion, rather than chasing them.
What AI-Assisted Analytics Changes (And What It Doesn’t)
AI-assisted analytics isn’t about replacing your existing SBC monitoring or handing decisions over to a model. It’s about changing when you notice risk and how you interpret what your traffic is trying to tell you. Instead of reacting after congestion shows up, it helps you see the signals forming while there’s still time to act.
- Instead of waiting for metrics to cross preset thresholds, it detects small but consistent shifts in behavior that typically precede congestion.
- Rather than treating all traffic the same, it learns how your SBC behaves across different times of day, regions, and traffic types.
- Instead of looking at SIP, RTP, and infrastructure metrics in isolation, it connects them to show how issues build across layers.
- Instead of alerting you when users are already affected, it surfaces early warning signs of SBC congestion while the experience still looks “mostly fine.”
- Instead of relying on gut feel to plan capacity or changes, it gives you evidence you can use to plan SBC upgrades using AI-backed insight.
And what doesn’t change? – Humans still make decisions. It doesn’t change your responsibility to make decisions or understand your network. And that’s exactly why it works, because catching problems early matters far more than who ultimately fixes them.
But spotting anomalies is only half the job. The real value comes from understanding which ones matter.
AI analytics correlates signals across SIP, RTP, transport, and infrastructure to show whether you’re looking at normal variation or genuine risk. That context is what separates noise from something you should act on.
From there, insights translate into action:
- Early alerts that surface risk before users are impacted
- Recommended mitigation steps like rerouting traffic, tuning policies, or addressing upstream issues
And one thing matters more than model precision: explainability. If the system can’t explain why it’s raising a flag, engineers won’t trust it. Accuracy scores don’t prevent outages; clear reasoning does.
Pro Tip
Early Detection → Low Cost
Late Detection → High Impact
Can design a small cost curve with caption (“The later you detect congestion, the more expensive it becomes.”)
That’s how AI analytics moves from observation to prevention, helping teams act while there’s still time to change the outcome.
Say “no”🚫 to SBC congestion, not “time, please”✌️ before it costs you outages, penalties, and lost trust.
How to Build AI-Based SBC Analytics?
Building AI-based SBC analytic solutions isn’t about adding a model on top of your SBC and hoping for insights. It’s about designing a system that understands voice traffic the way operators do, contextually, continuously, and with enough clarity to support decisions.
The good news is you don’t need to rip apart your existing stack to do this. Most of what you need already exists. The challenge is how you put it together.
1. Data Sources and Collection
AI doesn’t need all SBC data, it needs the right signals.
Most environments already collect SIP logs, RTP statistics, CDRs, and infrastructure metrics. What’s usually missing is alignment. These data sources live in silos, timestamped differently, and analyzed separately.
The first step is ensuring these signals can be correlated:
- SIP behavior over time
- Media quality management trends during active calls
- Infrastructure and network conditions underneath
Without this foundation, AI learns fragments rather than patterns.
2. Traffic Behavior Analysis
Traditional monitoring starts with limits. AI-based SBC analytics should start with behavior.
Instead of asking “Did a metric cross a line?”, the system should learn how traffic normally behaves across time of day, geography, codecs, and call types. From there, it can detect drift, small but consistent changes that usually precede congestion.
This shift is critical. It’s what enables AI to surface early warning signs of SBC congestion rather than reacting after the damage is done.
3. Cross-Layer Correlation
An anomaly only becomes meaningful when it’s seen in context.
A rise in retries might be harmless on its own. Slight packet loss might be expected. Load imbalance could be temporary. But when these signals appear together, across SIP, RTP, transport, and infrastructure, they often point to a real problem forming.
AI-based SBC analytics should be designed to connect these layers automatically, so operators don’t have to manually piece the story together during an incident.
4. Alerting and Response
Detection without action is just noise.
A useful system doesn’t stop at flagging anomalies. It helps answer:
- Is this normal variation or a growing risk?
- How fast is it changing?
- What should be done now to prevent escalation?
That’s how insights turn into early alerts and recommended mitigation steps, such as rerouting traffic, adjusting policies, or addressing upstream behavior while calls remain stable.
5. Explainability and Trust
One of the biggest mistakes teams make is prioritizing model accuracy over trust.
If engineers can’t understand why something was flagged, they won’t act on it. AI-based SBC analytics must explain what changed, where it changed, and how different signals are connected.
Explainability is what makes AI usable in operations, and it matters far more than abstract accuracy scores.
6. Operational Readiness
Finally, AI-based analytics only works if teams are ready to respond.
Clear ownership, response playbooks, and feedback loops are essential. As teams act on insights, the system learns. Over time, this creates a cycle where detection improves, responses get faster, and planning, especially capacity planning and upgrades, becomes evidence-based.
That’s when AI-based SBC analytics stops being a tool and starts becoming part of how the operation thinks.
Avoid These Mistakes When Building AI-Based SBC Analytics
❌ Don’t use disconnected data.
❌ Don’t treat AI as an add-on.
❌ Don’t prioritize accuracy over explainability.
The moment analytics influences action before impact, SBC operations move beyond status reporting.
And after covering how congestion forms, why monitoring misses it, and how AI changes the equation, here are your key takeaways!
The Bottom Line?
Early warnings don’t stop outages. People do. But people can’t act on signals they never see.
- The real advantage is seeing failure forming, not responding after impact
- The real question isn’t “Should we use AI?” but “Why are we still flying blind?”
- Early insight will always beat faster reaction
This is where Ecosmob helps. By enabling AI-assisted analytics on real SBC traffic, Ecosmob helps teams uncover early warning signs of SBC congestion, make smarter operational decisions, and reduce surprises in production.
Because outages rarely come out of nowhere. Most teams just don’t notice them knocking.
FAQs
What are early warning signs of SBC congestion?
Early warning signs of SBC congestion usually appear as subtle traffic changes rather than obvious failures. These include gradual increases in call setup time, rising retry behavior, shifting SIP response patterns, packet loss trending upward without crossing limits, and uneven load distribution across SBC instances.
How does AI-assisted analytics help with SBC monitoring?
AI-assisted analytics learns how SBC traffic typically behaves over time, across geographies, codecs, and call types. Instead of waiting for failures, it detects behavioral drift and correlated anomalies early, helping teams spot risks before they escalate into outages.
How can teams build AI-based SBC analytics?
To build AI-based SBC analytics, teams need correlated access to SIP logs, RTP metrics, CDRs, and infrastructure data. The focus should be on learning traffic behavior over time, correlating signals across layers, and surfacing explainable insights that operators can act on.
Can AI-assisted analytics help plan SBC upgrades?
Yes. AI-assisted analytics helps teams plan SBC upgrades using AI-backed insight by identifying recurring congestion patterns, capacity stress points, and growth trends before outages force reactive scaling.
When should teams consider adopting AI-based SBC analytics?
Teams should consider AI-based SBC analytics when congestion issues are discovered late, alert fatigue is common, traffic complexity is increasing, or outages are often first reported by customers instead of monitoring systems.


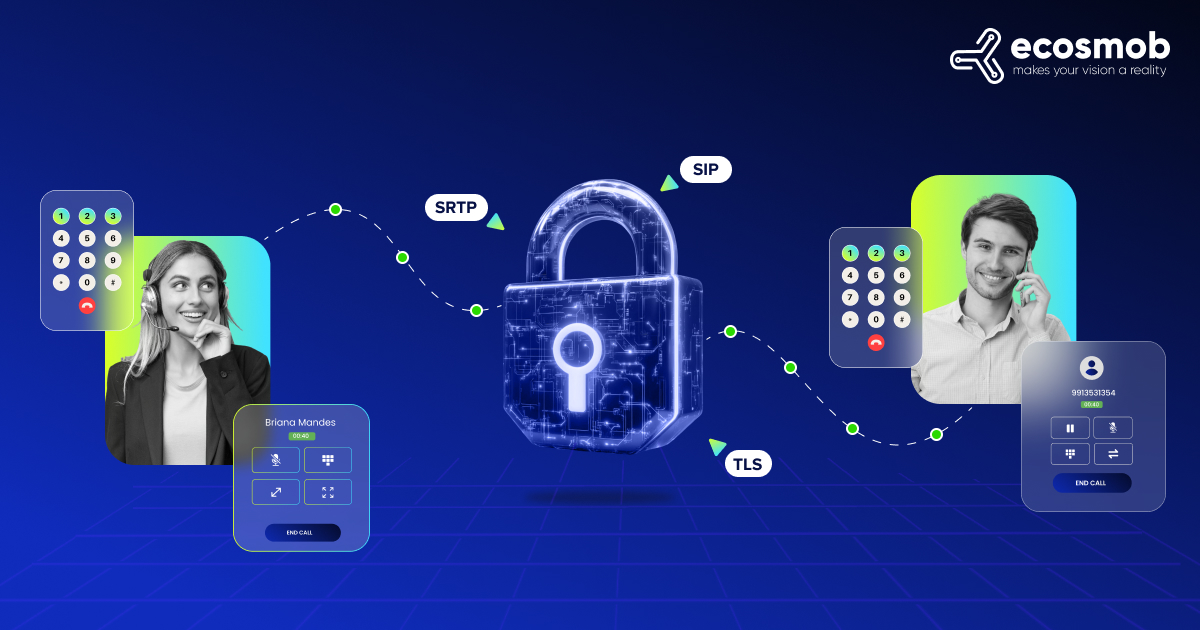
![SIP Protocol [SIP Signalling]](https://cd3e0a26.delivery.rocketcdn.me/wp-content/uploads/2024/12/Blog-79.jpg)