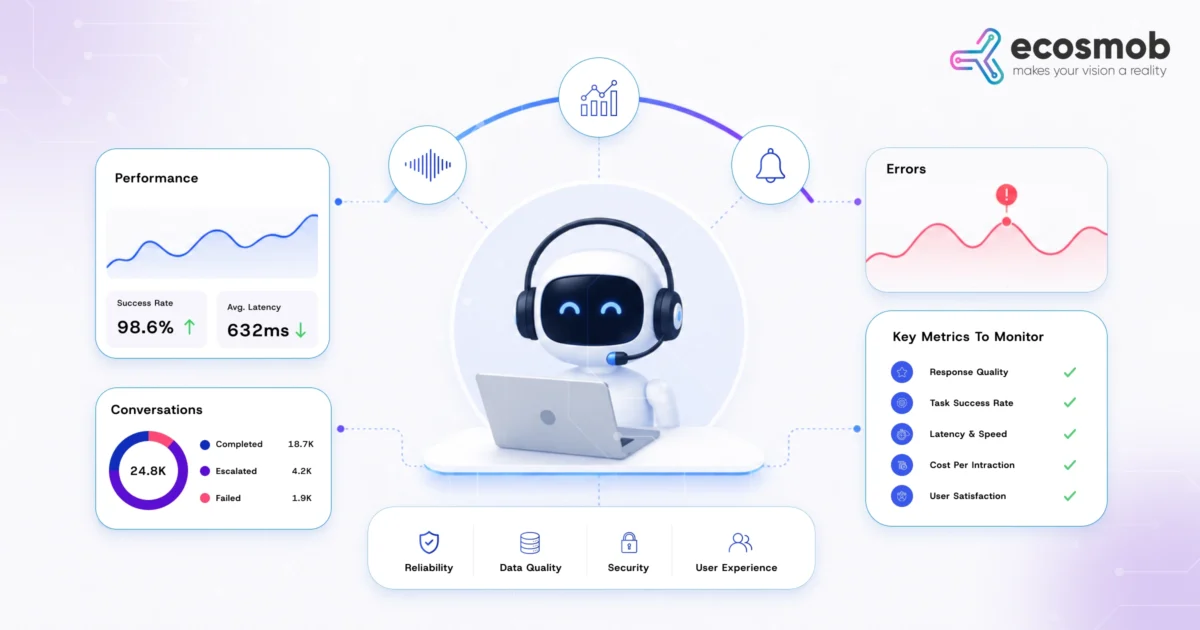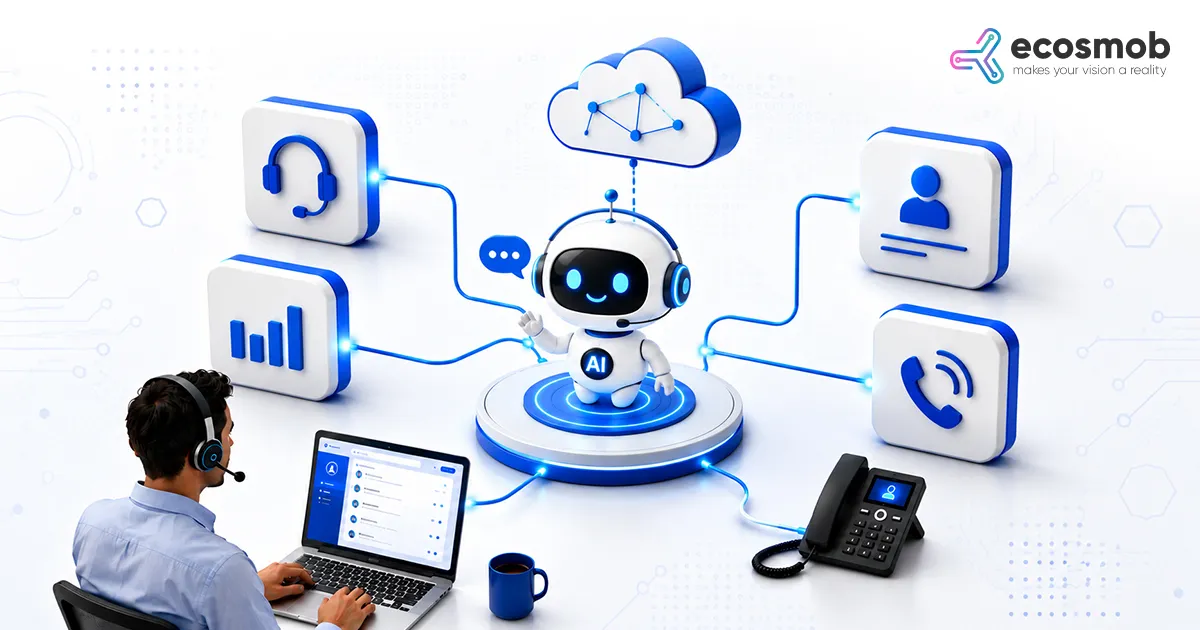

Voice AI observability is the continuous collection, correlation, and analysis of real-time telemetry across four decoupled layers: the carrier signaling plane using Session Initiation Protocol (SIP), the media transport path using Real-time Transport Protocol (RTP), the conversational artificial intelligence pipeline (STT, LLM, TTS), and business outcomes like task completion and containment.
When an engineering team launches an autonomous voice agent, standard Application Performance Monitoring (APM) dashboards like Datadog, New Relic, or Prometheus tell an incomplete story. A Central Processing Unit (CPU) monitor might show healthy 12% server utilization, and your LLM gateway might report pristine 200 OK responses with a 150-millisecond Time to First Token (TTFT).
Yet your callers are hanging up after 20 seconds.
In real-time voice, failures occur at the seams between independent protocols. A caller says “Actually, wait,” but your Voice Activity Detection (VAD) model misses the acoustic cutoff due to upstream packet loss over an unmanaged carrier trunk. The bot keeps talking, the caller talks over it, and the interaction breaks down.
Standard text observability tools like LangSmith or Arize catch the prompt tokens, but they are blind to the underlying SIP BYE cause code or the RTP jitter buffer drops that caused the interruption failure.
Building an observable voice AI platform requires binding carrier-grade telephony telemetry directly to your machine learning spans.



Callers hanging up on your voicebot due to dead air or audio clipping?

What Is Voice AI Observability (And Why Generic APM Misses the Point)?
Voice AI observability is the practice of tracking, measuring, and correlating network, audio, and conversational metrics across an active telephone call to isolate why an agent failed, hesitated, hallucinated, or degraded in audio quality.
Generic APM platforms and text-only LLM tracing tools leave three major blind spots in voice production:
- They Are Text-Centric: Standard LLM monitoring tools ingest prompts, completion tokens, and embedding vector distances. They have no visibility into 8-kilohertz (8kHz) G.711 telephony codecs, audio sample rates, acoustic echo, or RTP sequence numbers.
- They Lack Media Plane Awareness: An agent might generate a flawless response, but if your FreeSWITCH or Asterisk media server encounters buffer underruns while pushing Linear16 (L16) Pulse-Code Modulation (PCM) over WebSockets, the caller hears garbled static. Generic APMs only see that the backend Hypertext Transfer Protocol (HTTP) handler returned a status code 200.
- They Miss Conversational Latency Dynamics: In a web chatbot, a 1,200-millisecond round-trip response feels fast. Over a telephone call, 1,200 milliseconds of dead air feels like an abandoned line. Traditional APM aggregates averages (p50), hiding the p95 and p99 long-tail pauses that cause callers to hang up.
Voice AI Testing vs. Voice AI Observability (Why Evals Cannot Catch Production Telephony)
A common trap for voice engineering teams is assuming that rigorous pre-launch evaluations (evals) eliminate the need for specialized real-time monitoring.
| Dimension | Voice AI Testing & Evals | Voice AI Observability |
| Operational Phase | Pre-deployment, CI/CD pipelines, staging | Live production traffic on active carrier trunks |
| Data Source | Synthetic audio, pre-recorded audio sets, clean text | Real human callers, noisy cell connections, dynamic trunks |
| Telemetry Scope | Model response quality, safety guardrails, prompt drift | Network jitter, SIP error codes, acoustic barge-ins, latency |
| Primary Goal | Validate baseline model accuracy and policy compliance | Detect real-world degradation, carrier drops, and edge bugs |
Voice AI testing proves that your agent understands the “happy path” under clean acoustic conditions. It verifies that your prompt yields the correct business logic when supplied with pristine 16-kilohertz (16kHz) audio.
Voice agent observability monitors what happens when real human variables hit the line: background highway noise, regional accents, packet loss across mobile networks, and carrier rate limits.
In short, testing validates your software; observability catches operational reality.
The 4-Layer Voice AI Monitoring Stack
This layer monitors the raw transport between the caller’s handset, the carrier, and your media gateway (Session Border Controller, Kamailio, Asterisk, or FreeSWITCH).
- SIP Signaling Metrics: Call setup time measured as Post Dial Delay (PDD), SIP response code distributions (486 Busy Here, 488 Not Acceptable Here, 503 Service Unavailable), registration expiry, and abnormal teardown events (BYE with Reason: Q.850;cause=16 normal clearing vs cause=41 temporary failure).
- RTP Acoustic Health: Cumulative packet loss, interarrival jitter, round-trip delay, and out-of-order packets collected via RTP Control Protocol (RTCP) receiver reports.
- WebSocket Transport: Connection handshake latency, socket buffer saturation, and frame drop rates on the full-duplex media fork.
Layer 2: Model & Pipeline Execution
This layer traces the sequential transformation of audio to text, text to reasoning, and reasoning back to audio.
- Speech-to-Text (STT): Word Error Rate (WER), Character Error Rate (CER), provider confidence scores, and transcription token latency.
- Large Language Model (LLM) Engine: Time to First Token (TTFT), tokens per second (TPS), context window token consumption, hallucination frequency, and tool/function execution latency.
- Text-to-Speech (TTS): Time to First Audio (TTFA), audio generation duration ratio evaluated via Real-Time Factor (RTF), and synthetic voice buffer underflows.
Layer 3: Conversational Dynamics & Audio Experience
This layer measures how the interaction feels to the human ear.
- Turn-Taking Latency: Total response latency from the exact millisecond the caller stops speaking to the millisecond the first audio packet leaves the media server.
- Interruption & Barge-In Rate: Frequency of times the caller speaks while the bot is playing audio, how many milliseconds it takes for the bot to cut its audio stream (barge-in stop latency), and false-positive interruptions caused by background coughs or breathing.
- Speech Cadence: Words Per Minute (WPM), speech-to-pause ratio, and caller sentiment shifts across conversational turns.
Layer 4: Business Impact & System Economics
This layer evaluates whether the voice agent accomplished its mission.
- Resolution & Containment: First Contact Resolution (FCR), successful task completion rate, self-service containment rate, and human escalation/transfer rate.
- Financial Unit Economics: Cost per conversation minute, token cost per intent, and telephony carrier minute charges.
Voice AI Key Metrics and Performance Thresholds
The table below outlines verified operational thresholds established by telecommunications standards and real-time voice architectures:
| Monitoring Layer | Performance Metric | Healthy Target | Degraded (Warning) | Critical Failure |
| Telephony | SIP Call Setup (PDD) | < 1,200 ms | 1,200 – 2,500 ms | > 3,000 ms |
| Telephony | Network Interarrival Jitter | < 20 ms | 20 – 40 ms | > 50 ms |
| Telephony | RTP Packet Loss Ratio | < 0.5% | 1.0% – 2.5% | > 3.0% |
| Pipeline | STT Finalization Latency | < 200 ms | 200 – 400 ms | > 500 ms |
| Pipeline | LLM Time to First Token (TTFT) | < 300 ms | 300 – 600 ms | > 800 ms |
| Pipeline | TTS Time to First Audio (TTFA) | < 150 ms | 150 – 300 ms | > 400 ms |
| Experience | Total End-to-End Turn Latency | < 800 ms | 800 – 1,200 ms | > 1,500 ms |
| Experience | Barge-In Interruption Stop Time | < 150 ms | 150 – 300 ms | > 400 ms |
| Business | Human Escalation / Transfer Rate | < 15% | 15% – 30% | > 40% |
Under the international standards established in ITU-T Recommendation G.114 (One-way transmission time), one-way mouth-to-ear delay under 150 ms is acceptable for natural conversational speech, delay between 150 ms and 400 ms requires operational caution due to noticeable interruptions, and anything exceeding 400 ms is formally categorized as unacceptable for standard voice network planning.
In conversational voice AI, that 400-millisecond network ceiling forms the outer boundary of your total turn-taking latency budget. When your STT, LLM, and TTS pipeline stages compound on top of raw network transit, exceeding 800 milliseconds total latency causes human callers to perceive dead air, speak again, and trigger conversational collisions.

Tired of prompt drift breaking your voicebot?
Voice AI Production Tracing (Correlating SIP Call-ID to Distributed AI Spans)
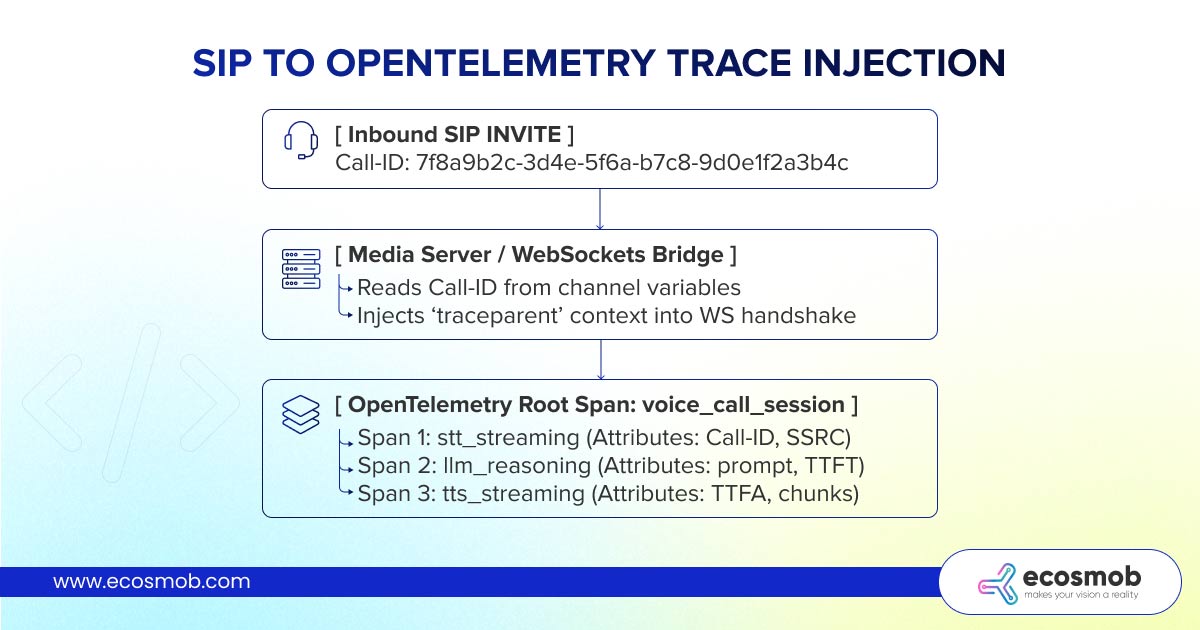
The primary failure mode in voice AI monitoring is treating telephony and machine learning as disconnected silos. Your telecom engineers debug Kamailio or Asterisk using SIP packet traces, while your machine learning engineers debug Python services using OpenTelemetry (OTel) or LangSmith. When a call breaks, neither team has the full picture.
To achieve complete observability, inject the SIP Call-ID directly into your distributed tracing context at the telephony ingress boundary.
Python Implementation: Correlating Media and AI Spans
Here is how to extract telephony identifiers from your WebSocket connection and initialize an OpenTelemetry session span:
import json
from opentelemetry import trace

tracer = trace.get_tracer("voice.agent.core")

async def handle_voice_session(websocket):
    # 1. Ingest initial handshake metadata from telephony bridge (e.g., FreeSWITCH/Asterisk)
    initial_frame = await websocket.recv()
    metadata = json.loads(initial_frame)

    sip_call_id = metadata.get("sip_call_id")
    caller_number = metadata.get("caller_id")
    media_ssrc = metadata.get("rtp_ssrc")

    # 2. Start root trace bound directly to the SIP Call-ID
    with tracer.start_as_current_span("voice_call_session") as session_span:
        session_span.set_attribute("telephony.sip_call_id", sip_call_id)
        session_span.set_attribute("telephony.caller_id", caller_number)
        session_span.set_attribute("telephony.rtp_ssrc", media_ssrc)

        try:
            while True:
                # Process audio frames and sub-spans for STT, LLM, and TTS
                audio_packet = await websocket.recv()
                if isinstance(audio_packet, bytes):
                    await process_audio_turn(audio_packet, session_span)
        except Exception as e:
            session_span.record_exception(e)
            session_span.set_status(trace.StatusCode.ERROR, str(e))
Binding the telephony.sip_call_id attribute across all sub-spans allows operators to query an alerting engine like Jaeger, ClickHouse, or Grafana Tempo with a single ID and immediately inspect the full end-to-end timeline: SIP handshake, RTP packet arrival, transcription duration, LLM token generation, and audio playback.
Commercial vs. Open-Source Voice AI Observability Tools
If you’re building voice agents, you must decide between specialized commercial platforms, general-purpose APMs, or open-source telemetry stacks:
| Tool / Platform | Category | Primary Strengths | Telecom / SIP Visibility |
| Hamming AI | Specialized Voice AI | Automated voice evals, barge-in analysis, latency breakdowns | Limited to basic audio quality; no SIP signaling inspection |
| LangSmith / Arize | LLM Tracing | Deep prompt inspection, token cost tracking, RAG evals | None; purely text and vector focused |
| OpenTelemetry + Homer / HEP | Open-Source Telemetry | Unified tracing; captures full SIP/RTP via Homer (SIP3) | Complete; captures raw signaling packets and media streams |
| Twilio Conversational Insights | CPaaS Native | Native integration with carrier trunking and call recordings | Locked to Twilio infrastructure; limited custom LLM spans |
For organizations operating their own SIP proxies (Kamailio) or media servers (Asterisk/FreeSWITCH), combining OpenTelemetry with Homer (SIP Capture) provides the most granular, un-siloed architecture. Homer captures raw SIP signaling and RTCP Quality of Service (QoS) metrics, while OpenTelemetry traces the internal application spans, allowing you to link both via the shared Call-ID.
Building this unified telemetry pipeline across SIP proxies, media servers, and LLM endpoints gives you total diagnostic visibility. But dashboards alone don’t fix a degraded carrier trunk at 2:00 AM or stop a subtle model regression before it wrecks your conversion numbers.
When Dashboards Aren’t Enough: 24/7 Voice AI Telemetry & Operations
Catching a 300ms latency spike is easy in a Grafana chart. Isolating whether it came from an AWS route flap, a saturated FreeSWITCH media bug, or LLM token choking during live traffic takes specialized telecom engineering.
At Ecosmob, we go beyond setting up your observability stack and run it with carrier-grade reliability:
- 24/7 Telemetry & Incident Ops: Continuous tracking of MOS and call latency, backed by a strict sub-15-minute P1 SLA.
- Proactive Drift & Cost Protection: Scheduled evaluation cohorts, automated drift alerts, and carrier billing reconciliation.
- Continuous Tuning & Optimization: Active A/B prompt testing, policy updates, and dynamic knowledge base syncing.
- Decades of Telecom NOC Pedigree: Carrier-grade operational oversight built directly into real-time LLMOps.
Instrumenting a voice agent is fundamentally different from monitoring an API or a database.
When a web service runs 300 milliseconds slow, a spinner turns on a screen, and the user barely notices. When a voice agent runs 300 milliseconds slow, the silence feels deafening, callers start interrupting, and the bot falls into an unrecoverable hallucination loop.
Achieving true reliability means breaking down the artificial wall between your telephony infrastructure and your machine learning code.
When your engineering teams can trace a customer grievance from the exact SIP disconnect cause code down through the RTP jitter buffer, the STT word error rate, and the prompt completion tokens, you stop guessing why calls fail.
You fix the root cause, protect your customer experience, and deploy voice automation that actually delivers on its promise.
Whether you need to architect a unified OpenTelemetry and Homer pipeline from scratch or need an experienced carrier NOC to monitor and protect your live voicebots around the clock, our team is built to keep your voice infrastructure running at zero-defect performance.
Frequently Asked Questions
Voice AI observability tracks, correlates, and analyzes real-time telemetry across an active call: carrier Session Initiation Protocol (SIP) signaling, Real-time Transport Protocol (RTP) packet health, Speech-to-Text (STT) accuracy, Large Language Model (LLM) latency, and Text-to-Speech (TTS) synthesis. Unlike generic APM or text-only LLM tracing, it isolates failures spanning both telecom networks and AI pipelines.
Voice AI testing evaluates conversational logic, safety guardrails, and prompts before deployment in staging environments using synthetic audio or text. Voice agent observability monitors live production calls, capturing real-world variables static evals cannot replicate: mobile packet loss, carrier jitter, ambient noise, live user interruptions, and runtime model drift.
Yes. Telephony teams frequently build open-source stacks by pairing OpenTelemetry (OTel) for application and inference tracing with Homer (SIPCapture / HEP) for SIP signaling and RTP quality monitoring. WebRTC frameworks like LiveKit also provide open-source telemetry hooks to track audio packet delivery and pipeline latency.
The telephony gateway extracts the unique SIP Call-ID from the incoming INVITE header and injects it as an attribute into the root OpenTelemetry span. Every downstream service (streaming transcription, prompt completion, tool execution, and voice synthesis) inherits this trace context, creating a single end-to-end timeline.
Network jitter causes packets to arrive out of order, forcing media servers to discard late-arriving frames once the jitter buffer is exceeded. This results in audio clipping and severe Speech-to-Text (STT) transcription errors, causing the LLM to misunderstand user intent even when raw network packet loss reads 0%.